Stress Pendant
A Smart Stress Ball that quantifies and maps Stressful Moments
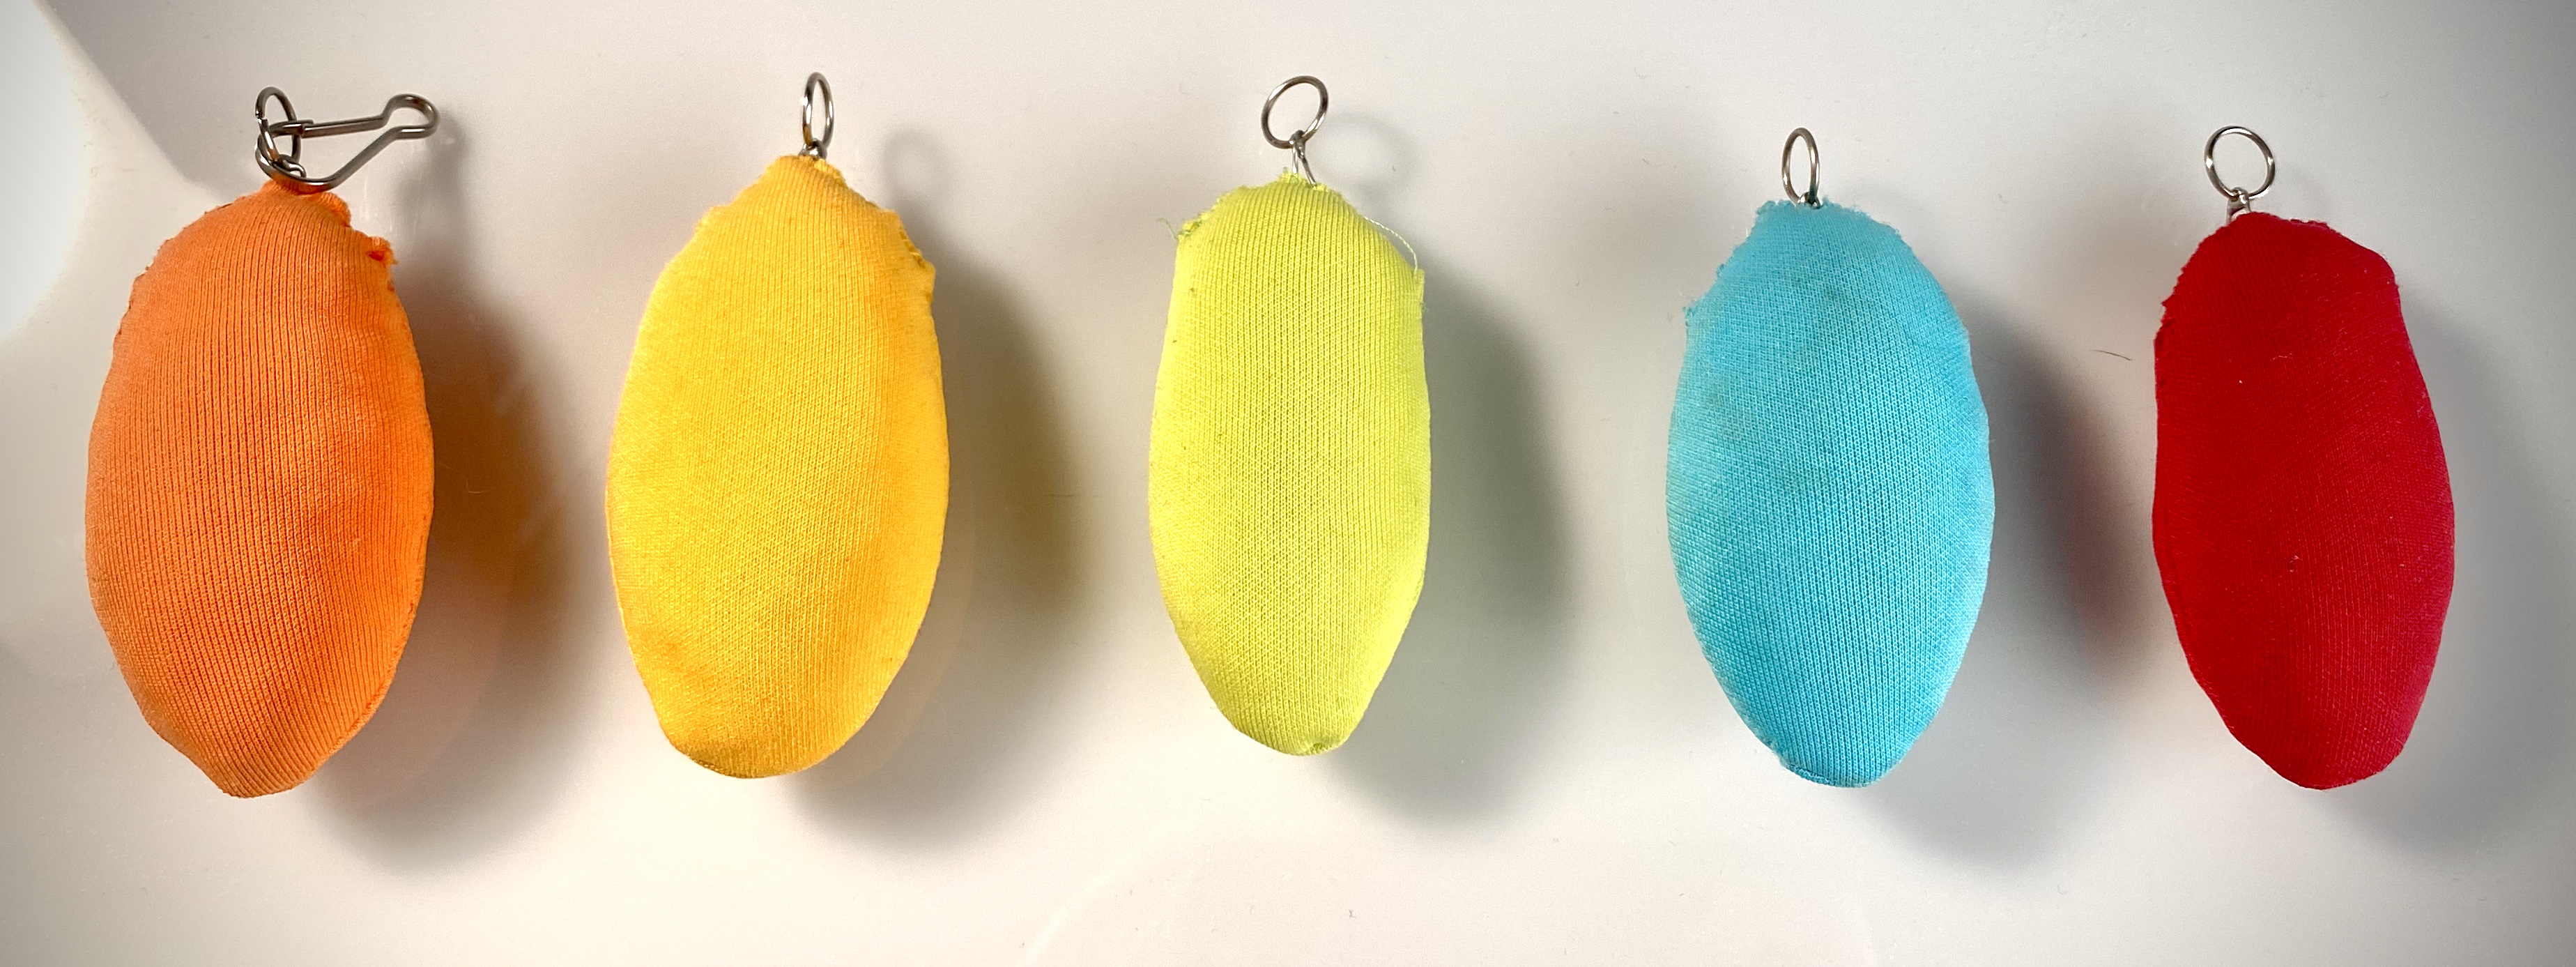
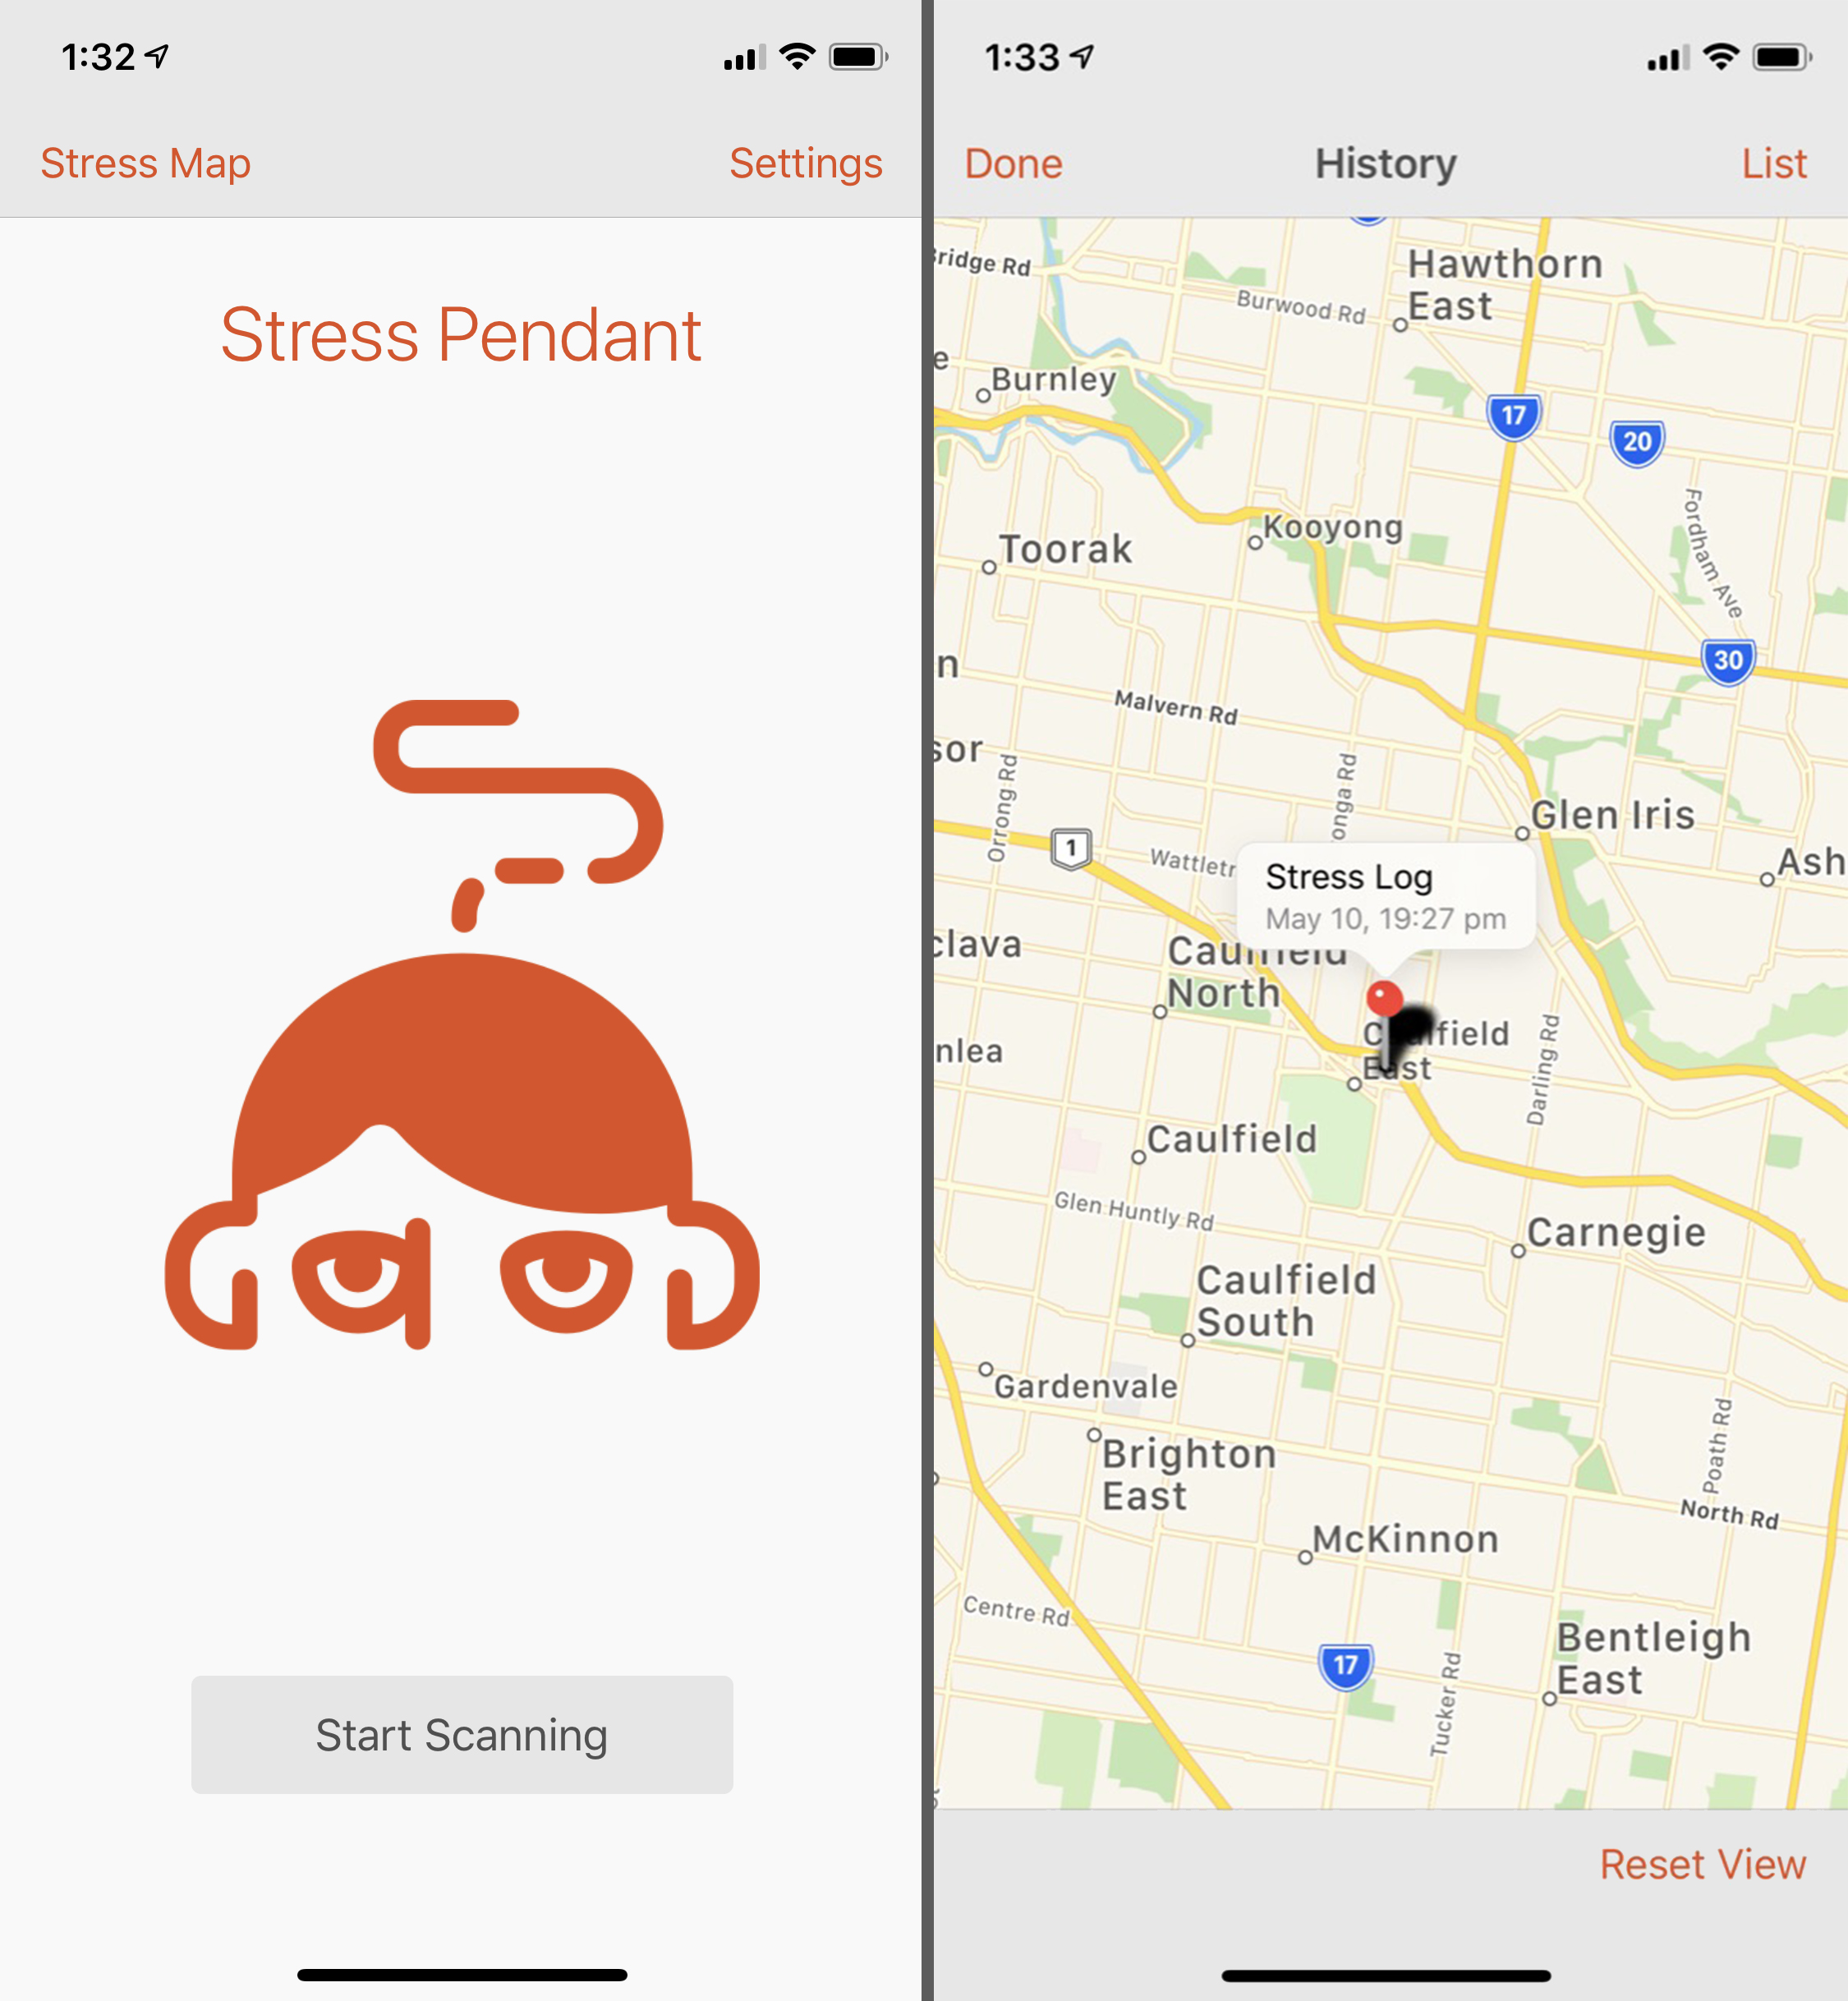
The Stress Pendant is a soft wearable device that responds to the squeeze of the user. Based on the idea of a Stress Ball, users would squeeze the device when feeling anxious or stressed. This interaction was logged by an accompanying smart phone app, storing the time and location of the stress event. The device used haptic feedback to provide the user with a reassuring ‘purr’ that acknowledged their stress. As the user interacted with the pendant over time they began to build up a personal ‘stress map’ of areas where they were experiencing higher levels of anxiety.
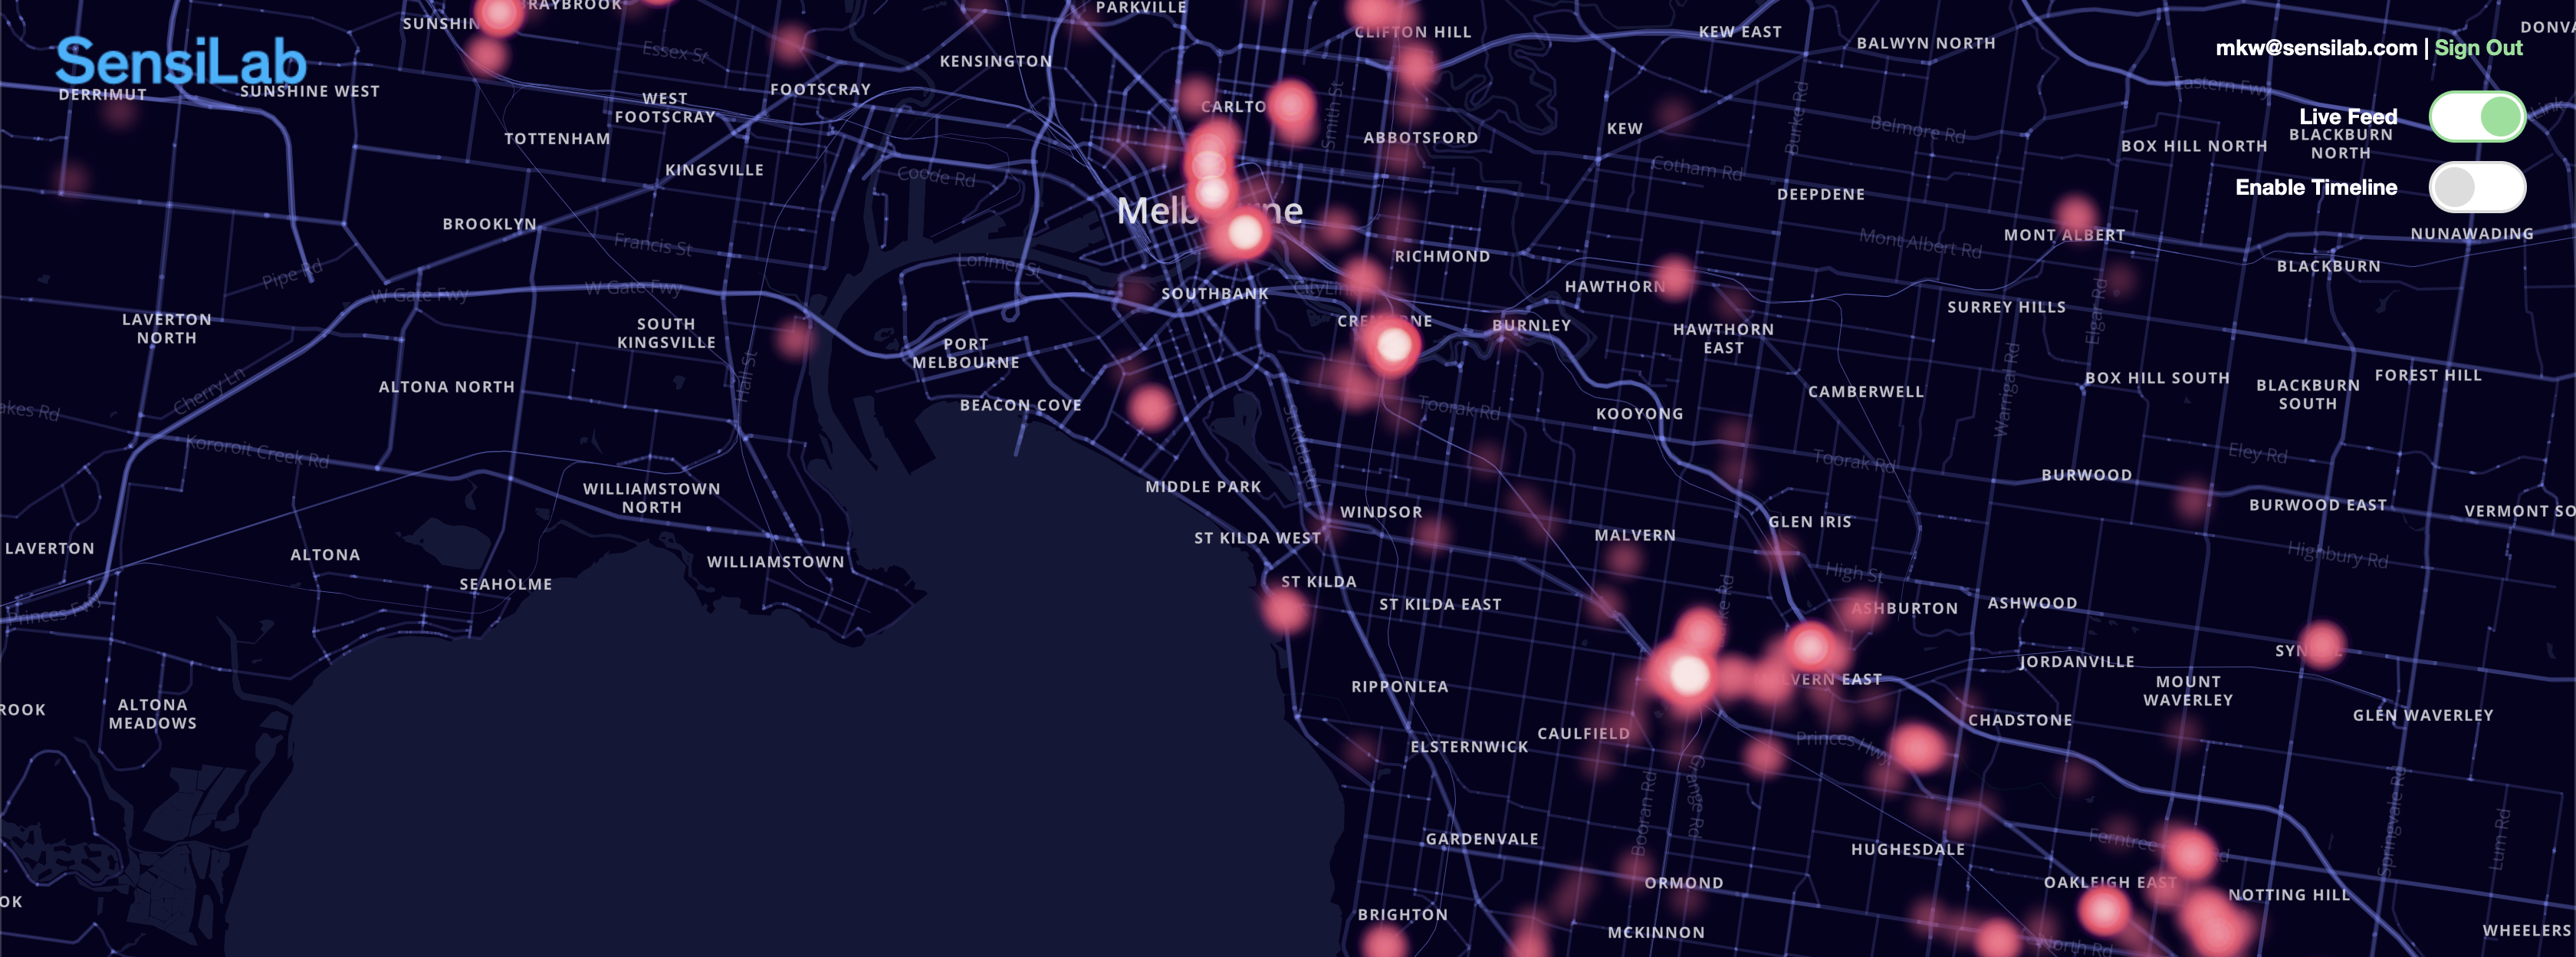
The pendant project was conceived as part of the 2016 Melbourne Knowledge Week. The theme for the event was “The Quantified Self” and we wanted to move away from fitness and health data and look at less commonly measured metrics such as mental health. We though that making people more aware of their stress was an interesting idea and we spent an afternoon brainstorming the idea. We realised that if we ended up creating a personal stress map for each user of the pendant we could overlay them all to create a stress map of greater Melbourne. We decided that for the event on the last day of Knowledge Week we would display the shared stress map of a weeks worth of data gathered from 40 participants who were attending the event.
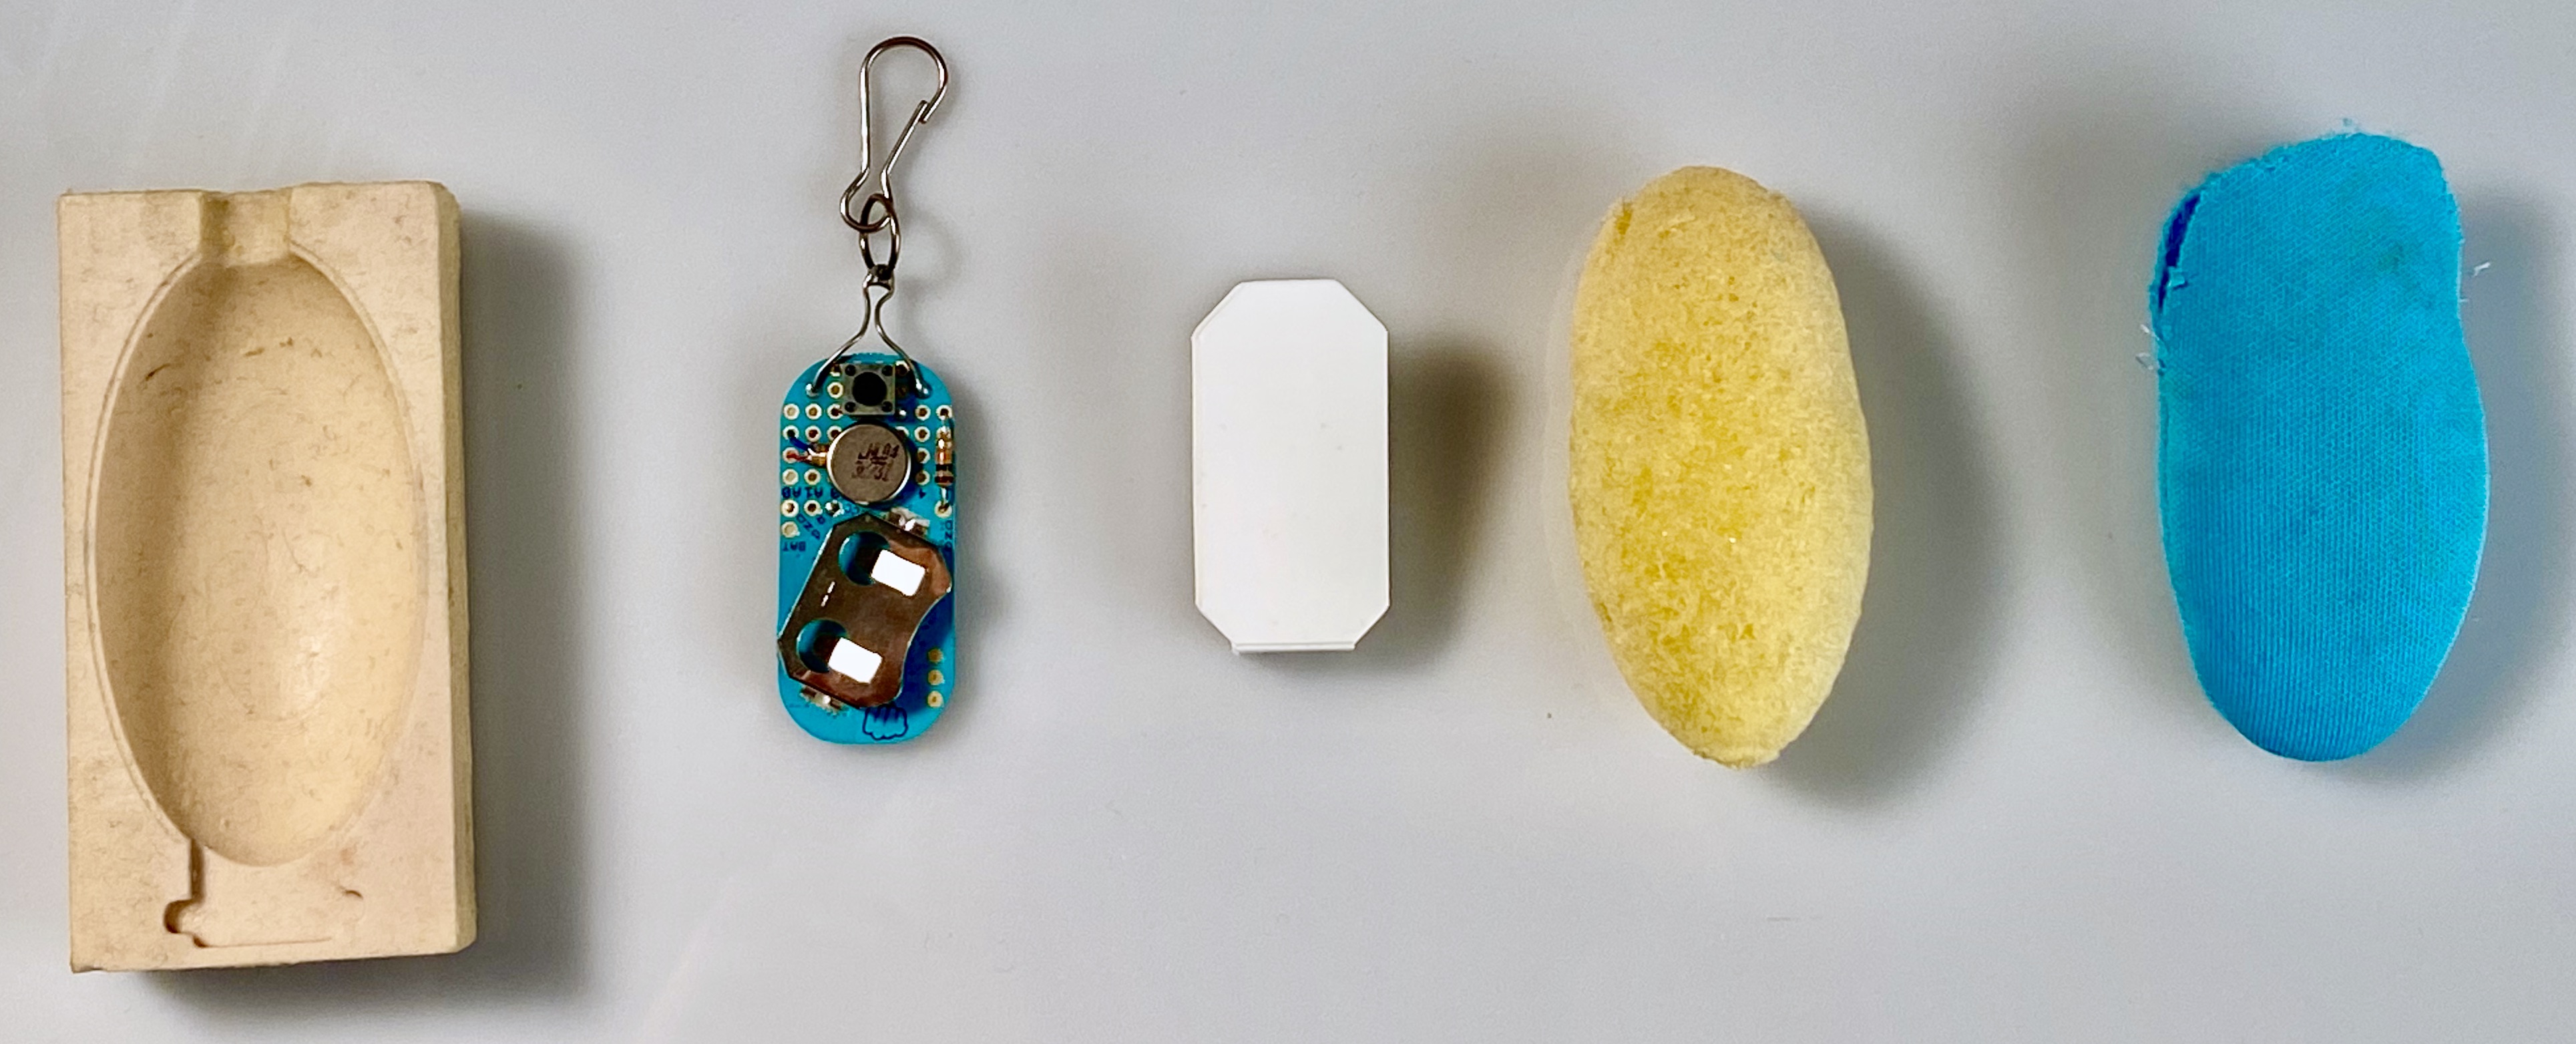
My part in the project was the design and fabrication of the pendant. The pendant itself consists of a small bluetooth LE enabled circuit board, a simple push button based system to register the squeeze, a haptic motor, a battery, a soft foam outer shell and a fabric cover. Apart from the base electronic components everything was made in house. Each board was hand soldered together, I designed and milled out a mould for the soft foam parts and cast them in polyurethane foam, the outer covers were sewn by hand and a small assembly team was gathered to put them all together. It was a huge undertaking and we worked quickly, from the initial idea to the 40 finished pendants only took about 3 weeks.

While the physical devices were being made a mobile app and web visualisation tool were being developed. The mobile app paired with the device via Bluetooth LE and served as the logging tool. It would register a squeeze and use the current phone location to determine where the user was. It would also transmit this information to an online database for the shared map. The web visualisation tool took all of the Stress Events from the users and displayed them on a map. It also had a ‘live’ mode which would dynamically update and move the viewport of the map to new stress events as they came in. This was running on the day of the event and it was quite exciting to see all of the data coming in live.

